Explore Climate Data to Inspire Action
Annually updated climate data in the places that matter to you
)
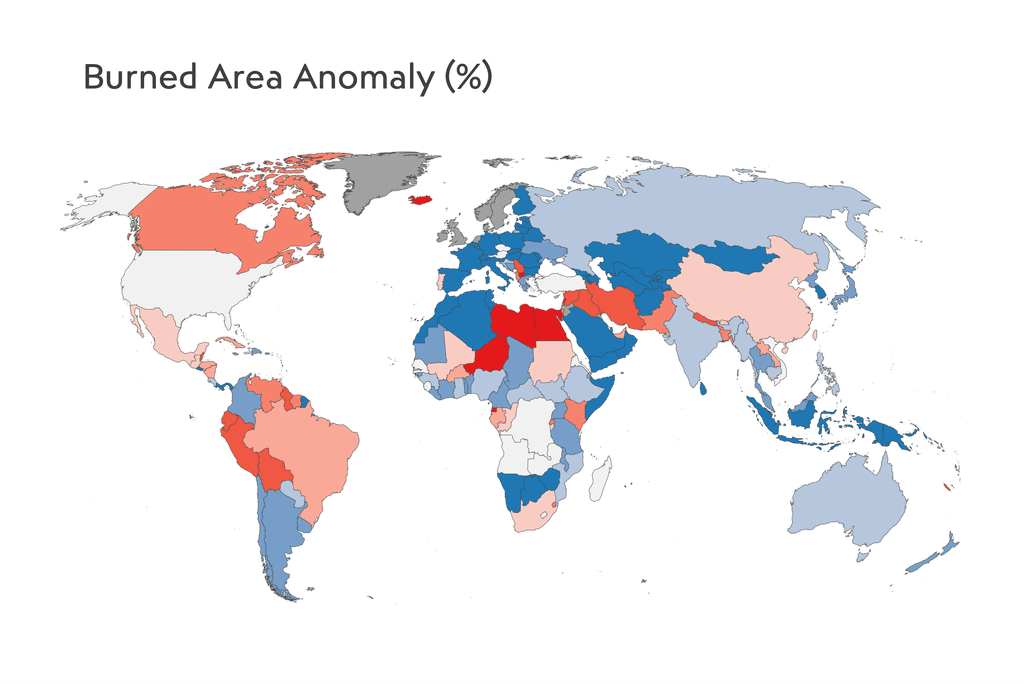
State of Wildfires
CompareMaps burned area, related CO2 emissions, and more by country, state, or ecological biome
)
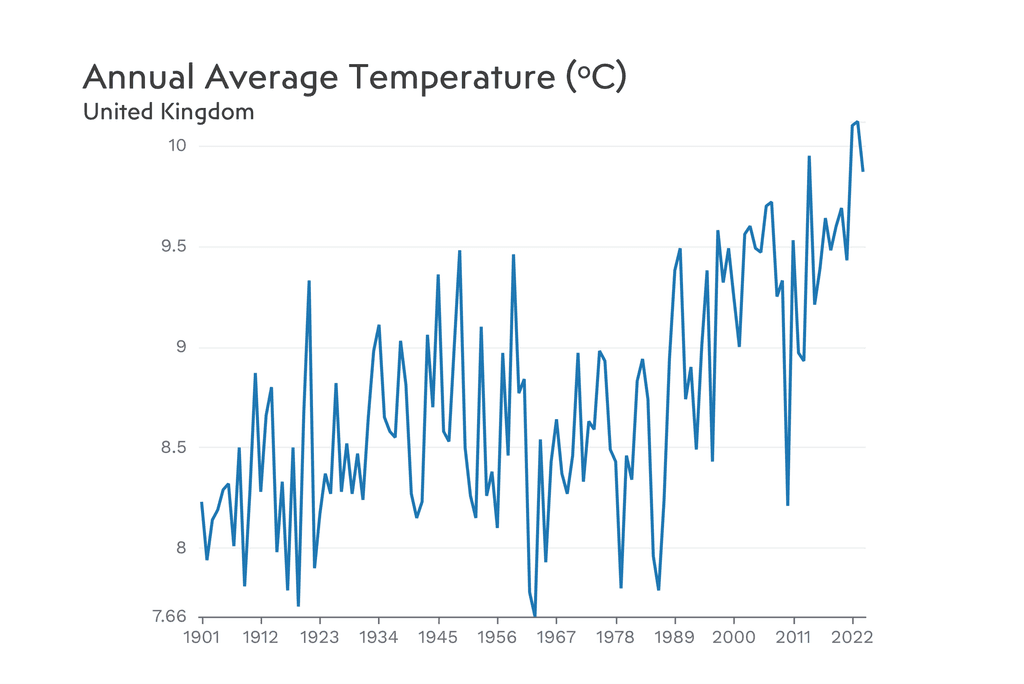
Climate Trends
ExploreCharts annual country trends across key variables including temperature, precipitation, and droughts
)
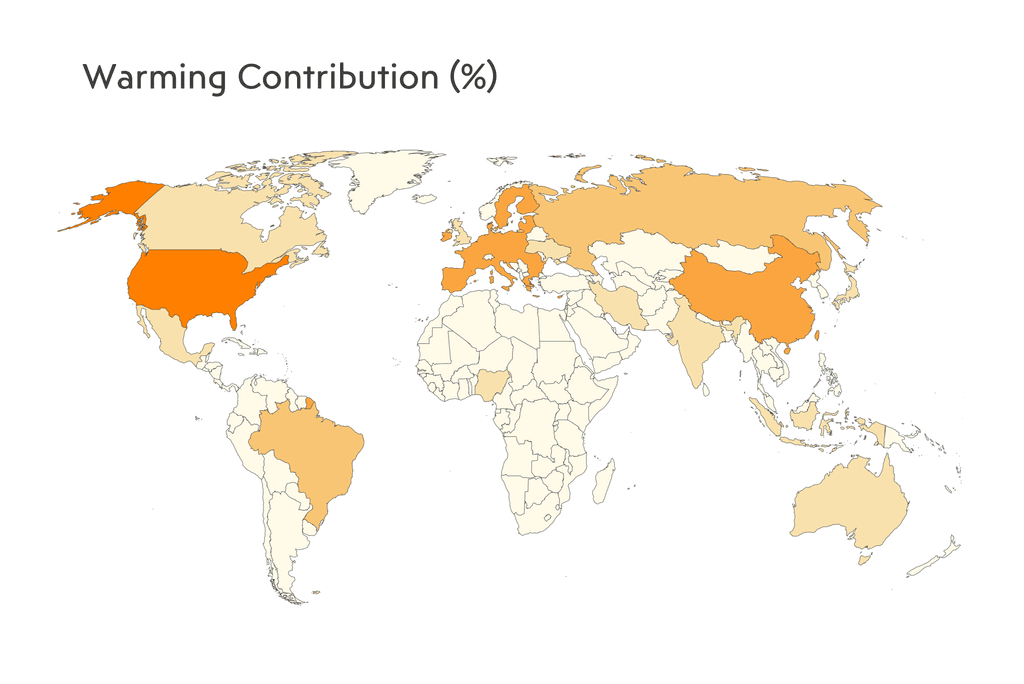
Warming Contributions
ExamineReveals each country's historic share of global warming from fossil fuels and land use change
Data visualisation maps and charts bring climate data to your device so you can explore the indicators of interest in the locations that matter to you. The Climate Data Dashboard supports awareness and understanding of climate and other environmental changes. To find out more visit our About page.
We encourage downloading and sharing of data and images under the Creative Commons licence (CC BY 4.0) with attribution to the original data providers indicated on each page.
Feedback: during beta testing of this recently launched website we encourage sharing your views via this short online survey.