Trends in Fossil Fuel Emissions
National CO2 emissions trends
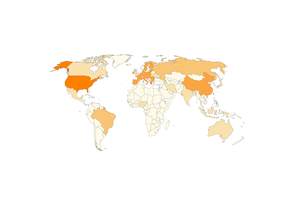
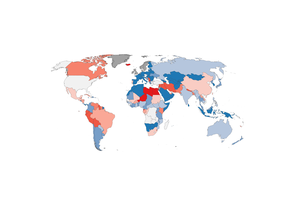
59 countries decreased their emissions while growing their economies between 2019 and 2025. This includes countries on every continent. Although not all these decreases are necessarily due to the deployment of clean technologies, the number of countries grows between each time period which suggests that climate action is spreading. Decreasing trends in CO2 emissions are more widespread for coal than for oil and gas.
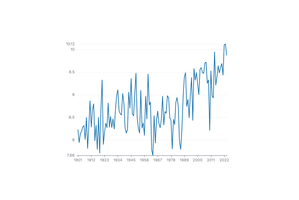
Global CO2 emissions from fossil fuels increased 0.85% between 2019 and 2025, despite many countries decreasing their emissions. However, emissions growth is slower compared to previous periods. Coal, oil, and gas emissions all increased globally during that period, by 1.3%, 0.5%, and 1.1% respectively. The global growth in emissions originates mainly from Asia, especially for coal.
Credit: National trends in emissions were first presented in the journal Nature Climate Change1, in a study of avoided CO2 emissions from the use of solar, wind power, and electric vehicles.
Data source: the Global Carbon Budget is an international initiative of the Global Carbon Project. Currently led by the University of Exeter, the Global Carbon Budget2 was initiated by the University of East Anglia’s Professor Corinne Le Quéré in 2006, who continues to contribute to its annual update alongside other researchers at UEA.
Emissions data are produced by researchers at the CICERO Center for International Climate Research. Emissions labelled as 'All Fossil Fuels' also include emissions from cement production and other processes.
For further information, visit these publications from the Global Carbon Project:
Le Quéré et al. (2026) A further acceleration of clean energy is needed for global CO2 emissions to peak and decline. Nature Climate Change, https://dx.doi.org/10.1038/s41558-026-02821-8
Friedlingstein et al. (2026) Global Carbon Budget 2026. Earth System Science Data, https://essd.copernicus.org/preprints/essd-2026-895/
The Global Carbon Project's fossil CO2 emissions dataset, 2026, https://zenodo.org/records/23667912, or directly in Excel format by clicking here.
How to explore the data
Select the variable you wish to display (e.g. all fossil fuels) and the geographic layer (e.g. countries). You can pan and zoom the map, as well as hover over a region to reveal the metric value in the top right corner. There are buttons to reset the display, save the map/table image, or to click for more information and to access original data or publication
Recommended attribution
Data from Global Carbon Project via the UEA Climate Data Dashboard, or GCP/UEA-CDD.
Feedback
During beta testing of this recently launched website we welcome your sharing of views via this short online survey.